Mapping Networked Organizations
Counterinsurgency tactics have increasingly focused on understanding networks - let's look at how that's done.
When intelligence analysts try to understand networked groups, they start with the raw material - intelligence reports from any number of human and technical sources, after-action reviews and reports from units on the ground, open sources such as news media and public statements from the organization itself, and so on. All of this information is converted into the fundamental unit of analysis, and our first focus today, the "dyad."
From the 2014 US Army counterinsurgency manual, FM 3-24:
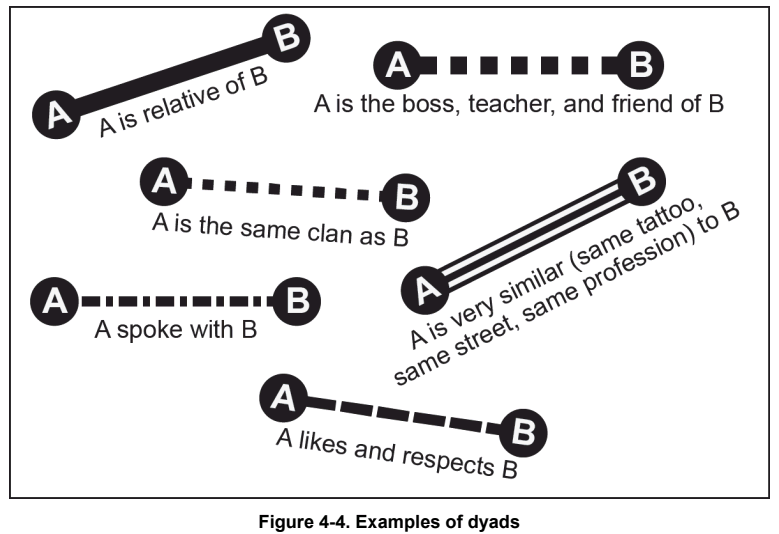
A networked insurgency consists of individuals and connections between them. Commanders and staffs can think of the individuals in an insurgency as actors or nodes. The connections between nodes are called links. This connection between two people is called a dyad. Understanding the various types of dyads is essential in understanding the nature of an insurgency.
These dyads represent the raw material that intelligence analysts can assemble into network maps of their target organization. Each piece of information ties more and more people into the network and creates a more complete picture of the target organization.
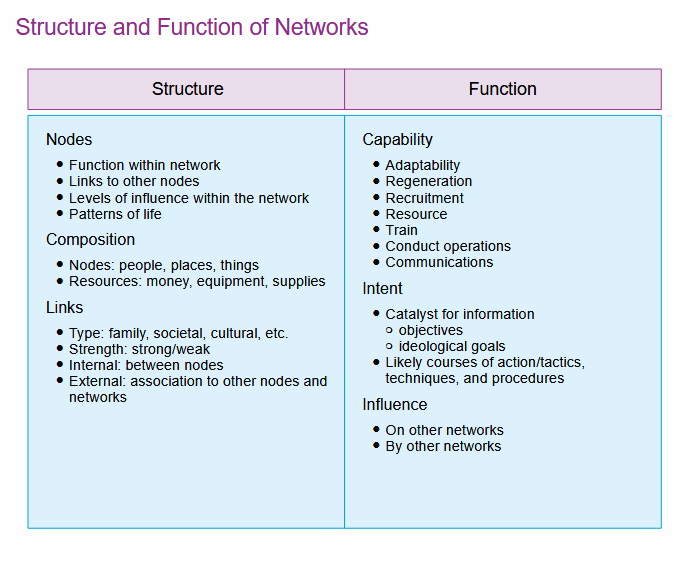
Importantly, even though the nodes are frequently individuals, they don't need to be. Nodes can be essentially any "noun" - people, places, or things - and choosing what to include is an important part of analysis. The key point is that every node serves some function in the network, and understanding each node and its function provides an understanding of how the network as a whole operates.
Once the process of collecting dyads within a network has begun, it doesn't have to remain passive - information from the network map can be used to target intelligence collection or other operations, which can then help further fill out the map of the network. A later article will discuss counter-network operations themselves in more detail, but it's important to understand that mapping and understanding a network is an ongoing process that moves back and forth between operations and intelligence work. Each new piece of information added to the network map opens up new possibilities and options for gathering further information as part of an ongoing cycle.
Traditionally, intelligence analysis is a highly qualitative process - "analysts read through raw intelligence on a given topic in order to author an intelligence assessment, build a brief or create a target package." [1] As the wars in Iraq and Afghanistan progressed, the analysis process began to incorporate more quantitative, "structured" methods of analysis, much of it based on networks.
Networks provide a structure that intelligence can be built on, allowing each new piece of information to be framed in terms of dyads and integrated into an overall picture. For an extremely diffuse, intelligence-driven activity like counterinsurgency, this process of aggregating or "fusing" intelligence is key, and analytic structures such as networks provide a way to do so. Analysts, overwhelmed with the amount of information that was being generated by large-scale counterinsurgency operations, were able to use tools like visual diagrams and network metrics to understand the insurgency, rather than reading through text or powerpoint-based reports and briefs. This allowed for analysis of much larger amounts of information in much less time, especially using quantitative measures - which we'll turn to next.
Network Metrics
Once a network map is in progress, intelligence officers (and social scientists) use a variety of metrics to understand the network and what role the nodes within it play. I'll briefly cover each of the main metrics, but it's worth keeping in mind that these measurements do not replace a qualitative understanding of the network - it's just one more lens for analysis. The real value of these metrics is in providing a starting place for further analysis.
More details about all of these metrics can be found in JP 3-25 Countering Threat Networks Appendix G.
Centrality
Many measures of centrality exist. At its core, these metrics are about finding the most important nodes in the network (for various definitions of "important"). These will frequently be hubs or leaders in the network - those that are highly connected to other nodes, close to a large part of the network, or important steps between different networks or parts of a network.
JP 3-25, Countering Threat Networks notes on page II-7 that
Although largely influenced by subjective judgment, identifying a potential key node may be facilitated through an analysis of network density, degree of centrality, and node centrality (i.e., how individual entities fit in the systems network). Node centrality can highlight possible positions of importance, influence, or prominence and patterns of connections. A node’s relative centrality is determined by analyzing measurable characteristics: degree, closeness, betweenness, and eigenvector.
Degree Centrality
Degree centrality essentially answers "who is the most connected." The degree of a node is how many links it has, so a node with high degree centrality is one that is highly connected via many links. This is a simple method, but the highly connected nodes in a network are frequently the "glue" holding the network together and can thus be key targets for anyone attempting to attack the network.
Closeness Centrality
Closeness centrality measures the distance from each node to all other nodes in the graph. The idea is that a node which can quickly reach anyone in the network (or at least more quickly than anyone else) is important. While individual "foot soldiers" of the network will frequently be near the edge of the network - connected to only their commander, and a few others in their immediate social vicinity - leaders and important operators tend to be closer to the "core" of the network, and thus have a short path to reach any other part of the network.
Betweenness Centrality
Betweenness centrality measures how important a node is as a connector or bridge within the network. If a network has two major components, and only one or two people sit between the components (a liaison position, or a coordinator between two groups), then their betweenness centrality will be high. This metric allows attackers to "disassemble" a network by removing the nodes that are most important for maintaining connections.
Density
Network density measures the amount that a network is connected - that is, how many links exist out of the total possible number of links. The counterinsurgency manual uses density as an indirect way to measure the network's capabilities, pointing out that "[a] decrease in network density means the group is reduced and becoming fragmented... An increase in network density indicates an increased likelihood that the insurgent group can conduct coordinated attacks."
On the flip side, lower density is a hallmark of the classic “cell structure” used by security-conscious organizations for decades. There are a lot of tradeoffs contained within network density for any underground group, but a lower density doesn’t necessarily mean the group is being defeated.
How Is This Used?
On page I-4, the US Army FM 3-60 Targeting (2023) discusses the practical application of this network analysis against a high value individual (HVI):
While the enemy moves from point to point, reconnaissance or surveillance tracks and notes every location and person visited. Connections between those sites and persons to the target are built, and nodes in the enemy's network emerge. Link analysis and life pattern analysis identify these relationships in order to complete the targeting folder. To be effective, there must be sufficient intelligence on the network the HVI belongs to in order to know the effect of their removal. Just because they are the cell leader may not be a good enough reason to target the individual. How will the cell be degraded by their removal? How long will it take to replace the individual?
This analysis has the effect of revealing the HVI's physical infrastructure for things such as funding, meetings, HQ, media outlets, and weapons supply points. As a result, the network becomes more visible and vulnerable. Nodal analysis uses the initial start point to generate additional start points that develop even more targeting opportunities within the enemy's network. The payoff of this analysis is huge but requires patience to allow the network's picture to develop over a long period of time.
Networks are notably resistant to the loss of any one or even several nodes. The focus of targeting is not just to identify an individual who is a leader in the network. Instead, it is to identify the critical leader whose removal will cause the most damage to the network. The ultimate success is to remove sufficient critical nodes simultaneously--or nearly so--such that the network cannot automatically reroute linkages but suffers catastrophic failure.
Summary
This article introduced how networks are mapped and understood - from building the initial network map of dyads extracted from a variety of sources to examining metrics that help build an understanding of the network’s structure and key nodes. Once information about a network starts being assembled, each new addition offers new ways to gather even more information in a continuing cycle. Next, we'll examine how this intelligence picture is used to start and sustain that cycle and ultimately (in theory) destroy the targeted organization.
[1] https://smallwarsjournal.com/jrnl/art/analysis-in-combat-the-deployed-threat-finance-analyst